I noticed a pretty neat UI interaction in Ayah for iOS that I wanted to
see if I could replicate in Android.
You’ll notice a few different things here:
on pressing the thumb, the search and jump buttons disappear, and the track expands.
when the track expands, the thumb sometimes moves accordingly (ex for 0% and 100% cases, the thumb moves to the start or end of the track, respectively).
the page doesn’t move until the person’s finger starts to move.
I wanted to try the same thing in Compose, and decided to write this blog post documenting my experiences.
Material 3 Slider in a Row
The first attempt was to use a Material 3 slider within a Row:
The full code can be seen here. All we’re doing here is having a row with the buttons - we explicitly add a modifier.pointerInput block so that, upon the first down event (press), we set isInteracting to true, therefore hiding the buttons. We finally clear isInteracting in onValueChangeFinished to restore the buttons.
This works, but has one problem:
While this gets us the expansion behavior we want, there’s one clear issue - the thumb is always lagging behind the “pointer” (in this case, the mouse, but on a device, the person’s actual finger). Why is this the case?
Under the hood, Slider uses Modifier.draggable as the last portion of the Modifier on the SliderImpl. The draggable modifier returns deltas - how much we moved in terms of pixels relative to where we were (instead of absolute positions). Upon pressing down, the buttons are still showing, so the down event is on the Slider at its “collapsed” position. The Slider records a press offset based on the old coordinate system (before expansion of the Slider).
Then, when movement happens, the drag gives us a delta of the motion, which is applied to a raw offset and press offset that was set up before expanding the slider (i.e. it is relative to the old coordinate system). This ends up being the core problem - we’re adding a delta to the old coordinate system, when we’re in the new coordinate system at this point. If we think about the 0% or 100% case, when collapsed, the x might be buttonWidth or width - buttonWidth, but, when expanded, the x becomes 0 or width instead. Using the old x and adjusting it per drag motions will thus leave a gap between the actual finger and the thumb position.
(Note: if you’re curious about the code that actually causes this, check the usages of rawOffset within the dispatchRawDelta method, and the SliderState.onPress method, which sets the original pressOffset based on the down event).
Material 3 Slider in a Box
Given that changing the size of the component doesn’t update the M3 Slider’s internal in-progress gesture state (though it does re-layout and reflects the new width, it doesn’t recalculate the active drag offset), what if, instead, the Slider is always full width, and the buttons draw on top of it?
The full code is here. The code is very similar to the old one, but uses a Box instead of a Row, and draws the buttons above the Slider. This has one obvious problem, which is that the thumb will be hidden underneath the buttons when the percentages are close to 0% or 100%. Other than that, the effect pretty much works the way we want it to.
One obvious idea is that, since M3 allows us to set a thumb composable, we can pass one with a Modifier that offsets the thumb to start at buttonWidth (or end at width - buttonWidth). We can try this by adding a Thumb with an explicit offset like this:
The full code is here. What we’re essentially saying is that we’ll set the offset to be between buttonWidth and -buttonWidth based on the percentage - closer to the middle, we’re at a 0 offset, and closer to the sides, we’re at the +/- the button width.
So there’s clearly a mismatch here - we can see that there’s a gap between the thumb and progress (more notable on the left and right sides of the slider than in the middle). The middle is where the offset is closest to 0. (Note that there’s also a second bug, which is that we sometimes can’t go to the last page. With the recorded emulator width, the slider usually stops at around page 594, but can differ depending on the device width).
Given that, can we tweak the offset to make this more correct? Instead of using a linear interpolation, what if we do something like, “if the x is less than buttonWidth, set it to buttonWidth, and if it’s greater than width - buttonWidth, offset it by -buttonWidth”? The full code is here.
We’ll notice that here, we’re fairly close! In most cases, things work correctly. We fixed our first problem now, but our second problem remains, however - the maximum we can easily move the slider is to width - buttonWidth. The reason for this (and for the other problems we saw above) is that offset shifts the Thumb visually, but does not shift the Slider’s internal state of where the Thumb is. In the Slider, our thumb is between 0 and screenWidth. Even if we offset by buttonWidth at the start, we can move to 0 without a problem. At the end, however, screenWidth is the maximum for the seekbar, and when we’re at that width, we’ve shifted the Thumb by an offset of -buttonWidth.
In reality, because of our block setting the offset to 0 when we’re interacting and the proper offset otherwise, there are really two cases. The first is where we’re interacting (i.e. moving the slider) - in this case, we can reach the end easily. Given this, why is there a problem? The reality is that most of the time, as we approach the end of the screen, the gesture automatically ends (because we’re approaching the end of the screen). In those cases, the gesture stops, the offset exists, and we can’t reach the end. In other cases, we can continue moving without being stopped. In those cases, we can properly reach the end.
Custom Slider
What if we fix these problems with writing our own Slider? Let’s split it into three parts - drawing, gesture handling, and the overall composable. The full code for this is here.
Drawing
Let’s start with the drawing part. Drawing is fairly straightforward - we have a track and a thumb. The track itself has 2 “pieces” - the background (showing the full width of the seekbar), and the foreground (showing the current progress). The thumb overlays both of those to show where the current progress is.
This looks like:
Canvas(Modifier.fillMaxWidth().height(56.dp)) {
  // draw the track - background is from visualStart to visualEnd
  drawLine(/* .. */)

  // draw the progress track - from visualStart to the thumb's x
  drawLine(/* .. */)

  // draw the thumb centered at its thumbX
  drawRoundRect(/* .. */)
}
Gesture Handling
So what about the gesture handling?
funpageFromX(x: Float): Int {
val start = 0f + thumbHalfPx
val end = widthPx.floatValue - thumbHalfPx
val range = (end - start).takeIf { it > 0f }
?:return latestCurrentPage
val fraction = ((x - start) / range).coerceIn(0f, 1f)
return (1f + fraction * (604f - 1f))
.roundToInt()
.coerceIn(1, 604)
}
Modifier
.pointerInput(Unit) {
awaitEachGesture {
val down = awaitFirstDown(requireUnconsumed = false)
onSetInteracting(true)
try {
val dragStart = awaitTouchSlopOrCancellation(down.id) {
change, _ -> change.consume()
onSetCurrentPage(pageFromX(change.position.x))
}
if (dragStart !=null) {
drag(dragStart.id) { change -> change.consume()
onSetCurrentPage(pageFromX(change.position.x))
}
}
} finally {
onSetInteracting(false)
}
}
}
Touch handling ends up being straightforward - we wait for our first down gesture and set ourselves to interacting (causing the buttons to hide). We then wait for the finger to move at least a “touch slop” amount (the intention being that if you tap without moving and let go, we don’t change the page). Once that happens, we update the page based on the actual x position of the finger. This is what lets the thumb match the actual finger, even after the resize.
The rest is just watching the drag state and setting the page based on the x position of the finger relative to the current size of the screen. Our pageFromX function takes care of mapping the x position to a page number (by figuring out the percentage of the current thumb and mapping that to the range of pages).
Putting it Together
The rest is just tying these parts up into a Box containing the Canvas with the Modifier for handling gestures.
This works! Why? The main reason is that our custom Slider is effectively stateless (in the sense that it calculates based on the current width and the current touch position instead of an internal drag offset), thereby keeping our drawing coordinates and our touch coordinates in sync. With the M3 Slider, changing the underlying width of the track, or visually offsetting the Thumb both cause the internal state to become out of sync with the visual state. This is the core problem that our custom Slider solves.
What do we Lose?
While this works, it’s a very simplistic version relative to the real Slider. We lose several crucial things:
Accessibility Support
Google makes this one a bit easy for us to add, using the semantics modifier and setting progressBarRangeInfo -
Under the hood, Slider’s SliderImpl sets a slideOnKeyEvents modifier that is private. This one handles various buttons - the directional keys, home, end, page up, and page down. Our code would also need to do this.
RTL Support
In this case, the slider is purely LTR. We’d need to handle RTL properly as well to have a fully functional slider.
Other Points
In general, with Google pushing us to support more platforms, will our custom Slider work well on a desktop or tablet? Will it work fine with a mouse or trackpad? In addition to all of this, we’d have to maintain this code ourselves and update it. Moreover, we hardcoded our colors instead of using Material theming out of the box.
Making a basic custom slider is easy, but making one that fully matches what the Material 3 one does is a lot of work. Nevertheless, it was fun to replicate this iOS effect on Android!
The desktop-head-unit is used for testing Android Auto apps, typically in conjunction with running on a physical device and then running desktop-head-unit --usb. What if we want to test an Android Auto app without a physical device?
The Android Auto version that can be seen on Google Play emulators says that “This app isn’t compatible with your device anymore.” Some time ago, I found a StackOverflow question that is the basis for this post (though this post is updated since things have changed since then).
First, download an apk of Android Auto. I tend to try to choose a newer arm64-v8a version with screen DPI of 120-640dpi. Download the file, and then extract it:
mkdir gearhead
cd gearhead
unzip ../com.google.android.projection.gearhead_<version>.apkm
Tweak the command to add other languages or customize dpi - for example, you can add split_config.{lang}.apk to add a particular supported language.
If that succeeded, you’re mostly there. On the emulator, go to settings, connected devices, connection preferences, and then choose Android Auto. Scroll to the very bottom and click the version many times to enable developer mode for Android Auto (this is a specific setting for Android Auto, though it is mechanically the same process as the normal one for enabling debug settings in Android).
Once you’ve enabled it, tap the three dot menu in the top right, and choose “Start head unit server.”
Finally, you can start it using:
# i always run these togetheradb forward tcp:5277 tcp:5277; desktop-head-unit
Every time you cold boot the emulator, you’ll need to re-start the head unit server again.
Recently, I needed to add a custom marker to a MapLibre map with the upcoming street name, while respecting various rules (supporting RTL, etc). Inspired by our iOS team, I solved this by writing the street name marker code in Compose, and then taking a screenshot of the Composable on demand and rendering it to the map. This solution worked well, and everything was great until I wanted to show the same markers on the Android Auto map.
This post will talk about how to use ComposeView outside of an Activity. This turns out to be useful for various use cases, including Android Auto, overlays, IMEs, bottom sheet dialogs, and potentially others.
tldr Android Auto
Android Auto does not provide us with an Activity, though we do have a CarContext (which is just a Context). Android Auto does not give a lot of flexibility in terms of how to build apps - there are templates that are pre-configured for the standard use cases that need to be used. The exception to this is that Android Auto provides a Surface on which content can be rendered (used specifcially for rendering a map, for example). In this case, I am already rendering the map, and just want to be able to generate the symbols I need to show on the map when I have no Activity.
Based on the documentation for Android Auto, we know we need a way to render a ComposeView. Simply making a ComposeView, however, is not enough, since it must be attached to a Window (failing to do this will result in an Exception being thrown). There are a few ways to do this, but all of them are based on the idea of using the WindowManager service to get a Window instance to attach the ComposeView to.
Using the way provided in the documentation, we can create a virtual Display. We can then use the Presentation class (which is a “a special kind of dialog whose purpose is to present content on a secondary display.” (ref)), add our ComposeView to it, and then show() it.
val displayMetrics = appContext.resources.displayMetrics
val displayManager = appContext.getSystemService(DisplayManager::class.java)

val virtualDisplay = displayManager
    .createVirtualDisplay(
        "ComposeScreenshotTaker",
        displayMetrics.widthPixels,
        displayMetrics.heightPixels,
        displayMetrics.densityDpi,
        // note - unlike the documentation, we pass null here since we
        // don't want to actually render to a particular surface.
        null,
        0
    )

val composeView = makeComposeView()
val presentation = Presentation(appContext, virtualDisplay.display)
presentation.setContentView(composeView)
presentation.show()

// after taking the screenshot
presentation.dismiss()

// later, when we're completely done with taking screenshots...
virtualDisplay.release()
Alternatively, we can directly call addView on a WindowManager with the proper WindowManager.LayoutParams, and add our View that way. This is how the MapLibre-Android-Auto-Sample attaches a org.maplibre.android.maps.MapView to the car today.
For Compose, simply attaching the ComposeView is not enough, and running this would give us:
java.lang.IllegalStateException: ViewTreeLifecycleOwner not found from androidx.compose.ui.platform.ComposeView{d1c5c98 V.E...... ......I. 0,0-0,0}
Because ComposeView is used outside of an activity, you must ensure that it or a parent view propagates a LifecycleOwner and SavedStateRegistryOwner. Use setViewTreeLifecycleOwner and setViewTreeSavedStateRegistryOwner to achieve this.
The setViewTreeLifecycleOwner takes in a LifecycleOwner, and the setViewTreeSavedStateRegistryOwner takes in a SavedStateRegistryOwner, which is also a LifecycleOwner. In a vanilla Activity world, ComponentActivity implements both interfaces for us, but outside of an Activity, we need to provide our own implementation.
// Taken and slightly modified from the original at
// https://gist.github.com/handstandsam/6ecff2f39da72c0b38c07aa80bbb5a2f
classCustomLifecycleOwner : SavedStateRegistryOwner {
privatevar lifecycleRegistry: LifecycleRegistry = LifecycleRegistry(this)
privatevar savedStateRegistryController: SavedStateRegistryController = SavedStateRegistryController.Companion.create(this)
overrideval lifecycle: Lifecycle = lifecycleRegistry
overrideval savedStateRegistry = savedStateRegistryController.savedStateRegistry
funhandleLifecycleEvent(event: Lifecycle.Event) {
lifecycleRegistry.handleLifecycleEvent(event)
}
funperformRestore(savedState: Bundle?) {
savedStateRegistryController.performRestore(savedState)
}
}
Now, we can just make a new one and set it on our ComposeView -
val lifecycleOwner = CustomLifecycleOwner()
val composeView = ComposeView(appContext).apply {
    this.setViewTreeLifecycleOwner(lifecycleOwner)
    this.setViewTreeSavedStateRegistryOwner(lifecycleOwner)
    setContent {
        // content
    }
}
If we now run this, we won’t get a crash, but no bitmap will be generated. That’s because we haven’t told our LifecycleOwner that we’re in ON_CREATE state or beyond. We do this by adding:
val lifecycleOwner = CustomLifecycleOwner()
// this line is important to ensure things are properly initialized.
// without it we'd get:
// java.lang.IllegalStateException: You can 'consumeRestoredStateForKey' only after the corresponding component has moved to the 'CREATED' state
lifecycleOwner.performRestore(null)

// technically, we only really need any one of these instead of all 3
// i add them to be consistent with the actual lifecycle.
lifecycleOwner.handleLifecycleEvent(Lifecycle.Event.ON_CREATE)
lifecycleOwner.handleLifecycleEvent(Lifecycle.Event.ON_START)
lifecycleOwner.handleLifecycleEvent(Lifecycle.Event.ON_RESUME)
We need to also make sure to properly clean things up when we’re done:
Molecule’s main page has a nice comic that states, “Molecule isn’t a framework, just a headless Compose runtime.” The headless part is exactly what we want, so can we use that instead? The short answer is no, because the Applier class for Molecule emits Unit (instead of LayoutNode) since it’s not expecting to emit ui nodes. Despite not rendering ui to the screen, we still need our Composer to be able to handle LayoutNodes to generate the Canvas operations that will ultimately be saved to a Bitmap.
An Applier is responsible for applying the tree-based operations that get emitted during a composition. Every Composer has an Applier which it uses to emit a ComposeNode.
Consequently, while Molecule is essential for non-ui logic, we can’t adapt it to this specific use case.
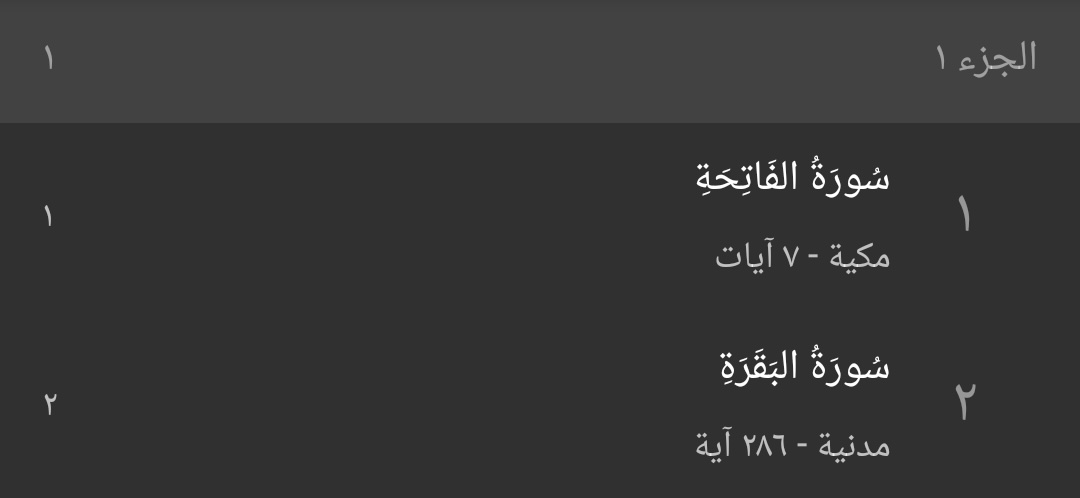
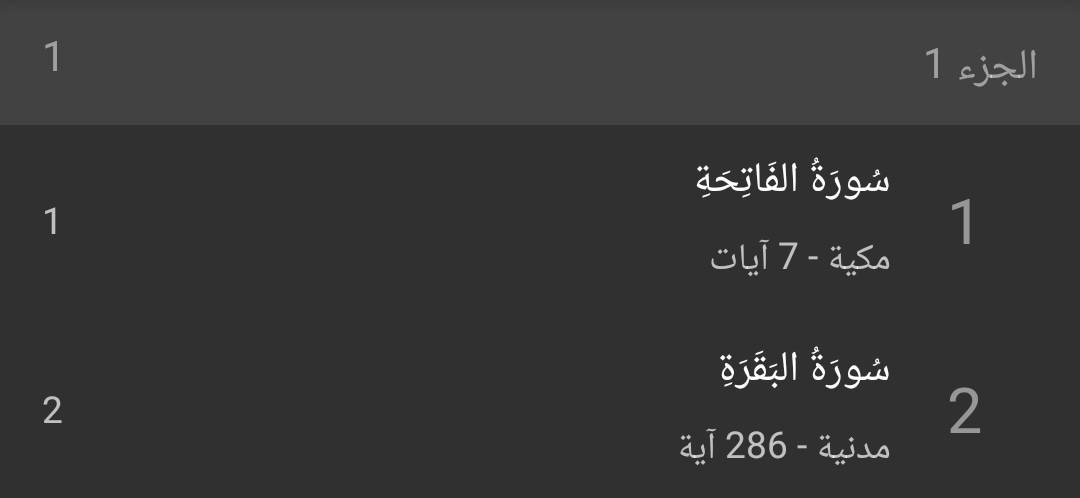
In Android 16, I noticed that my apps that explicitly tried to show Arabic-Hindi numerals (٠, ١, ٢, ٣, …), were now showing Western numerals (0, 1, 2, 3, …) instead. This happened irrespective of the phone’s primary locale.
Android 15, api 35
Android 16, api 36
Notice how the numbers everywhere are different - on Android 16, everything is using Latin numbers, whereas on Android 15, we’re getting the Arabic-Hindi numerals that we’d expect.
Side Note: The naming of the numeral systems is really confusing to me. The numbers as we write them in English, 1, 2, 3, .. are called “Arabic Numerals,” and the numbers as we’d write them in Arabic, ١, ٢, ٣, .. are referred to as “Eastern Arabic numerals,” or “Mashriqi” numerals, at least according to Wikipedia. Android region settings uses what I’ll translate as “Arabic Hindi numerals” (for the ١, ٢, ٣ variants) and “Western numerals” (for the 1, 2, 3) variants.
Typically, you’d render these numbers by using a formatter with the Arabic locale - i.e.
val formatter = NumberFormat.getNumberInstance(Locale("ar"))
formatter.format(42)
On Android 15 (api 35) and below, this code prints ٤٢, as it should. On Android 16 (api 36), it instead prints 42.
This was curious to me for a few reasons:
when I changed the locale of the os, the clock and numbers within the various os and Google apps (clock, calendar, etc) are correct.
there’s a settings panel for regional settings on Android 14 (api 34) and above with a specific option for how numbers are rendered. Changing this setting didn’t make a difference to the code above.
changing the phone’s locale still didn’t lead to the expected numbers.
I spent some time implementing App Specific Locales, thinking it would help, and, in the process, learned some interesting things.
Solution
The solution I discovered is just to pass a country parameter to the Locale itself - i.e. instead of Locale("ar"), make it Locale("ar", "EG") instead. This works on previous versions of Android as well (tested it on Android 21 and it works there), so this is the best solution for apps to take now. I’ve also filed a bug about this.
val formatter = NumberFormat.getNumberInstance(Locale("ar", "EG"))
formatter.format(42)
Numbering in Different Regions
In retrospect, Android “hints” at the requirement of passing in a country “variant” for Arabic by not allowing a person to simply select “Arabic,” but always showing a secondary menu for selecting a country.
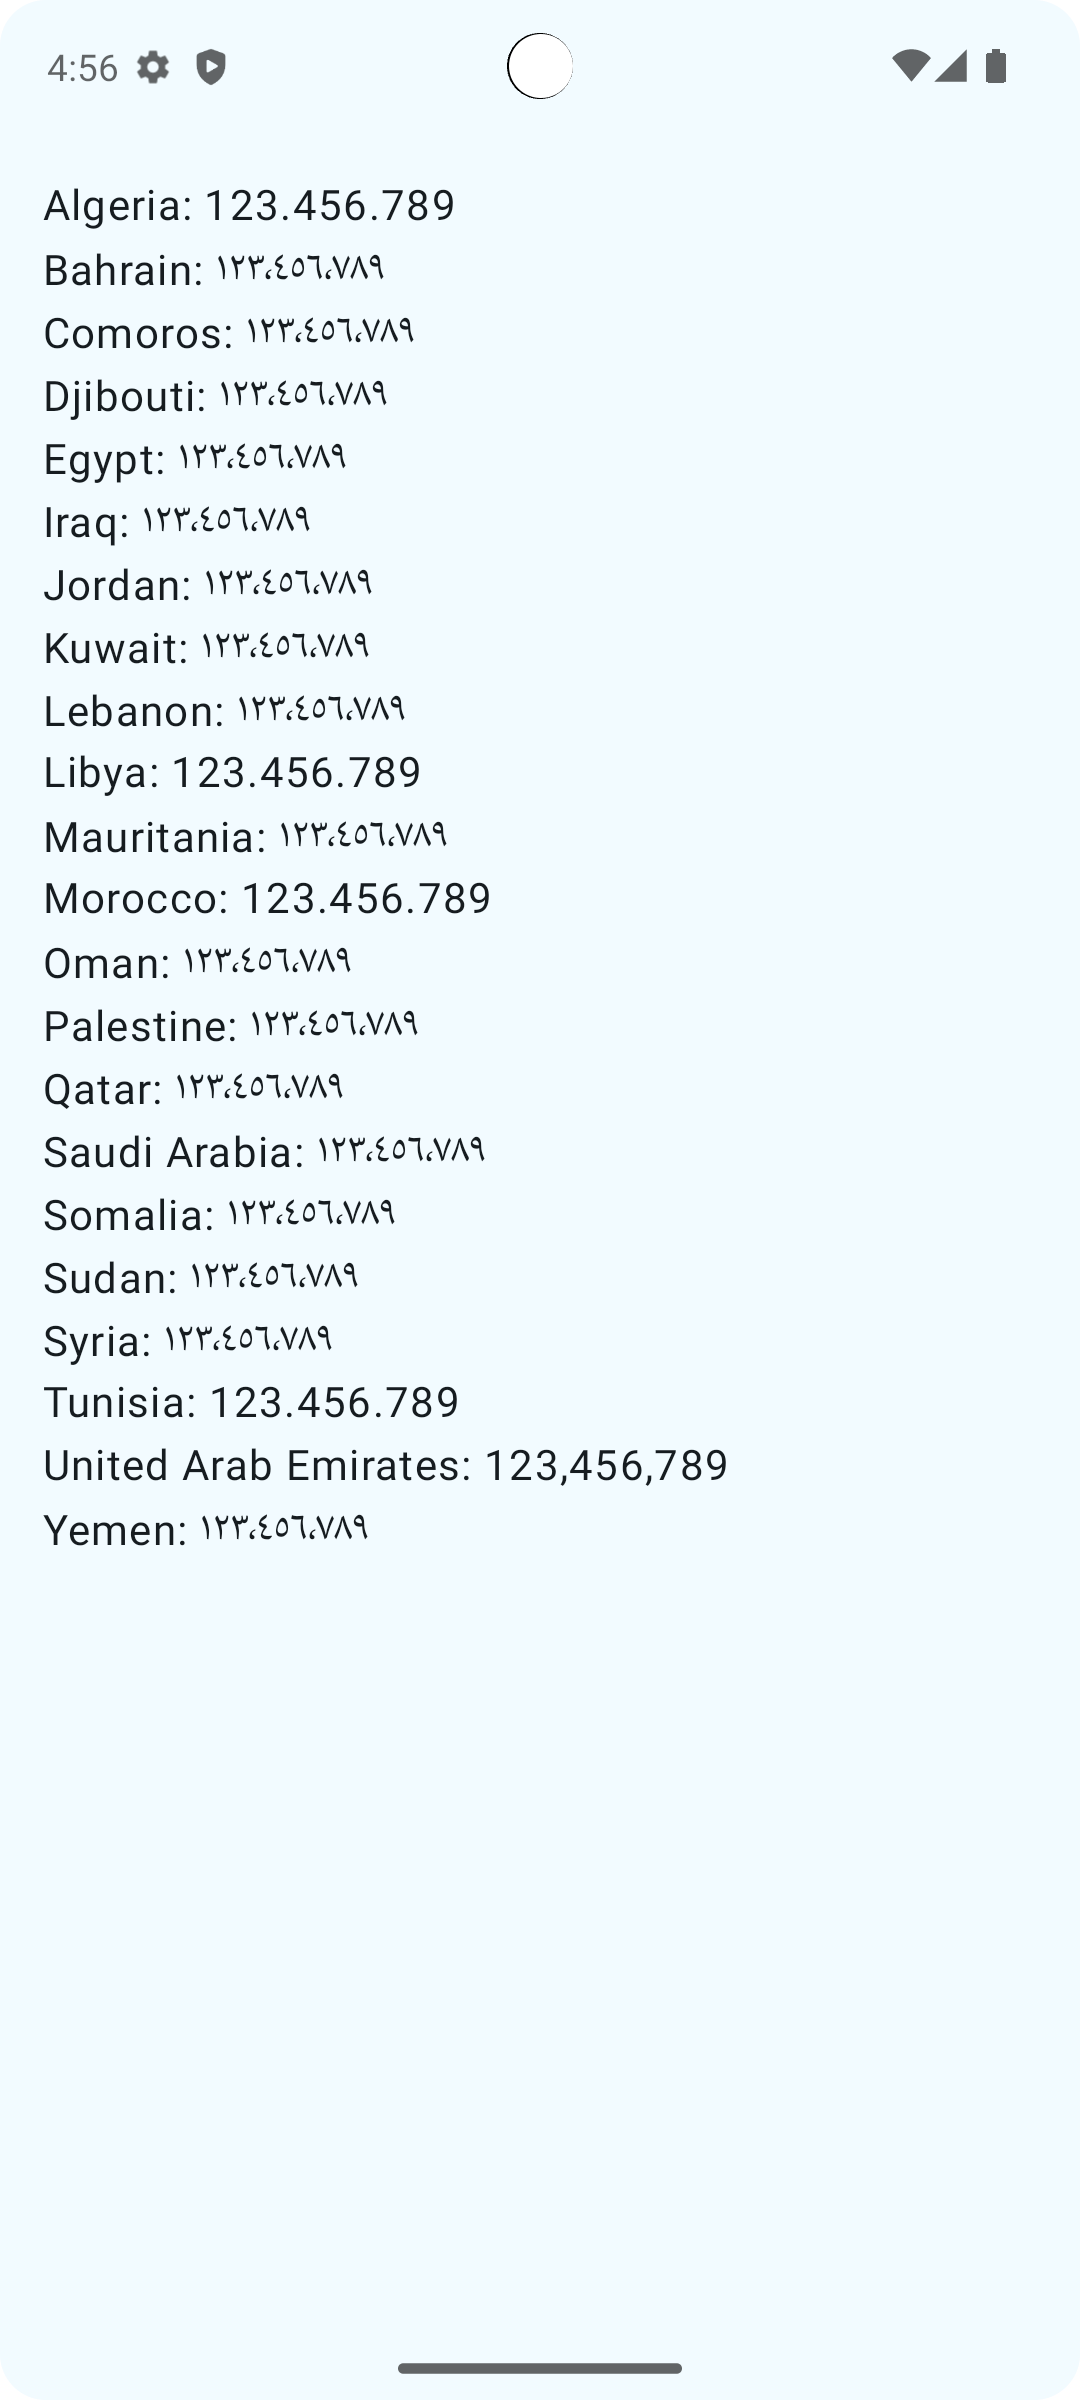
I did a simple test to see what each country would print:
val countries = mapOf(
"Algeria" to "DZ",
"Bahrain" to "BH",
"Comoros" to "KM",
"Djibouti" to "DJ",
"Egypt" to "EG",
"Iraq" to "IQ",
"Jordan" to "JO",
"Kuwait" to "KW",
"Lebanon" to "LB",
"Libya" to "LY",
"Mauritania" to "MR",
"Morocco" to "MA",
"Oman" to "OM",
"Palestine" to "PS",
"Qatar" to "QA",
"Saudi Arabia" to "SA",
"Somalia" to "SO",
"Sudan" to "SD",
"Syria" to "SY",
"Tunisia" to "TN",
"United Arab Emirates" to "AE",
"Yemen" to "YE")
@ComposablefunCountryNumbers(
modifier: Modifier = Modifier
) {
val number = 123_456_789 Column(modifier.fillMaxWidth().padding(16.dp)) {
countries.forEach { (country, code) ->val formatter = NumberFormat.getNumberInstance(Locale("ar", code))
Text("$country: " + formatter.format(number))
}
}
}
With the exception of Algeria, Libya, Morocco, Tunisia, and UAE, all countries output Arabic-Hindi numerals. Notice also the other effects of the regions - notice that for the locales showing Western numbers, ‘.’ is the separator, with the exception of UAE, which uses ‘,’.
CLDR and the Root Cause
How does the OS know to use Arabic Hindi numbers for some countries and Latin numbers for others? This data comes from CLDR, the Unicode Common Locale Data Repository.
We can look at the CLDR Repository to see the details for any given locale. For instance, looking at the ar_EG, we see:
In turn, ar.xml suggests that the default numbering system inherits from the parent (root.xml) which sets Latin, but if this is the case, why did this only change in Android 16?
I did some digging and found this issue on the Unicode tracker:
Change ar to default to ASCII digits. While many Arabic-speaking users prefer native digits, all understand ASCII digits: They are in widespread usage even in countries that prefer native digits. This would maximize understanding when we don’t know a user’s country, or a user selects Arabic but declines to select a regional variant.
also, in comment 8:
Stock ICU uses “standard” variant for ar.xml (Arab); Google etc will filter the data so that ar.xml gets <defaultNumberingSystem>Latn</…>
This happened in CLDR 33. Looking at the top of Locale.java, we see that Android 10 and above ship with CLDR 34+.
and run it on the command line, I get the expected ١٬٢٣٤٬٥٦٧ for both lines (using target bytecode for Java 22).
I suspect this means that the ordinary default is Arabic-Hindi numbers, and that Google is doing something specifically to make the default Western numbers.
We can use these tags to pass in additional information. Per the documentation of Locale:
UTS#35, “Unicode Locale Data Markup Language” defines optional attributes and keywords to override or refine the default behavior associated with a locale. A keyword is represented by a pair of key and type. For example, “nu-thai” indicates that Thai local digits (value:“thai”) should be used for formatting numbers (key:“nu”).
The keywords are mapped to a BCP 47 extension value using the extension key ‘u’ (UNICODE_LOCALE_EXTENSION). The above example, “nu-thai”, becomes the extension “u-nu-thai”.
We can therefore pass in a value to the key nu to set the numbering system to one of these two values:
nu-latn (use Latin numbers)
nu-arab (use Arabic-Hindi numbers)
// Arabic, for Saudi Arabia, with Arabic-Hindi digits
// this is the same as just `Locale.forLanguageTag("ar-SA")`
Locale.forLanguageTag("ar-SA-u-nu-arab")

// we can use this to not specify a language and get Arabic-Hindi digits:
Locale.forLanguageTag("ar-u-nu-arab")

// we can even use it to get Arabic numbers outside of Arabic:
Locale.forLanguageTag("en-u-nu-arab")
All of the above will print out in Arabic Hindi digits. We can similarly replace nu-arab with nu-latn to get Latin numbers for countries that default to non-Latin numbering.
// using this locale will give Latin numbers
Locale.forLanguageTag("ar-EG-u-nu-latn")
Responding to Region Changes
Android 33 (Android 13.0, Tiramisu) and above support App Specific Languages. Android 34 (Android 14.0, Upside Down Cake) also introduced region preferences. Region settings for Arabic numbers will only appear if Arabic is a system language. In other words, if I just set Arabic as an app language for one or more of my apps without setting it as a system language, I will not see the region settings screen.
Changing the numbering preferences sends Intent.ACTION_LOCALE_CHANGED and Intent.ACTION_CONFIGURATION_CHANGED broadcasts. As far as I can tell, these don’t have any extra data associated with them when the region is changed (i.e. intent.data and intent.extras are both null).
With respect to Locale.getDefault(), it only gets updated if:
the app’s language is set to “System Default”
the system default language is Arabic
Alternatively, setting the region alone will not update the default Locale unless you also update the app specific language (in the case of updating the
region, you’ll see a second language available in the list of languages - the selected one is with the old region, the new one is with the new region).
If we wanted to handle this within our app, we could register receivers for the two broadcasts and look at the systemLocales and act on it accordingly:
val localeManager: LocaleManager = getSystemService(Context.LOCALE_SERVICE) as LocaleManager
val systemLocales = localeManager.systemLocales
val currentDefaultLocale = Locale.getDefault()

// find all system matches for our current locale's language
val systemMatches = (0 until systemLocales.size())
  .map { systemLocales.get(it) }
  .filter { it.language == currentDefaultLocale.language }

// whenever we find a match that's different from our current locale, set it
// using the language tags.
val systemMatch = systemMatches.first()
if (systemMatch != currentDefaultLocale) {
    AppCompatDelegate.setApplicationLocales(LocaleListCompat.forLanguageTags(systemMatch.toLanguageTag()))
}
Because LocaleManager.systemLocales will reflect the currently selected region, using the code above will, in practice, switch from ar-EG to ar-EG-u-nu-latn and vice versa, allowing Locale.getDefault() to reflect the currently selected region.
When upgrading an app to target Android 15 (targetSdk 35), edge to edge layouts are enabled by default. While the documentation about doing this for Compose and Views is very detailed and has everything needed for the migration, I want to call out some quick points that weren’t immediately obvious (or that I missed in the documentation the first time).1
Android 29 and Below
Typically, handling edge to edge is just a matter of targeting Android 35, calling enableEdgeToEdge(), and applying the appropriate insets to the layouts to make things look correct. Setting these insets usually takes the form of:
ViewCompat.setOnApplyWindowInsetsListener(view) { view, windowInsets ->// extract the insets we care about for this view
val insets = windowInsets.getInsets(
WindowInsetsCompat.Type.systemBars() or
WindowInsetsCompat.Type.displayCutout()
)
// apply the padding
view.updatePadding(left = insets.left, top = insets.top, right = insets.right, bottom = insets.bottom)
// or margin
// (requires a MarginLayoutParams friendly parent, ex FrameLayout)
view.updateLayoutParams<MarginLayoutParams> {
topMargin = insets.top
leftMargin = insets.left
bottomMargin = insets.bottom
rightMargin = insets.right
}
// return a WindowInsetsCompat here removing whatever insets we
// consumed that children should receive, or CONSUMED to consume all.
WindowInsetsCompat.CONSUMED
}
One of the things I noticed was that, after getting the layout working properly on Android 35, it looked like my insets were being ignored on Android 24 when I tested it there.
Whenever we apply an OnApplyWindowInsetsListener and consume the insets, Android 29 and below do not dispatch the insets to siblings. This causes sibling views to never have their listener fired. This is described more in the documentation here. There are two fixes for this.
The first, described in the documentation, was added in the 1.16.0-alpha01 or above versions of androidx’s core / core-ktx libraries (the latest as of this writing is androidx.core:core-ktx:1.16.0-rc01). It can be used by calling this function to allow Android 29 and below to behave similarly to Android 30 and above.
// before setting window insets listeners and applying them
ViewGroupCompat.installCompatInsetsDispatch(rootView)
Note that this fix also fixes the same issue happening with usages of android:fitsSystemWindows="true".
A second fix would be just to return the insets back from the listener (instead of consuming them). This has the implication that children of this ViewGroup would get these same insets again and have the option to react to them, which can cause double padding if it doesn’t make sense to do so (for example, if the parent handles the insets for the navigation bar, there’s likely no reason for its children to do so).
1960s Navigation on Android 29 and Above
If you run the app on Android 29 and above on a device with the 1960s (3 button) navigation style, you’ll get a transluscent scrim on top of the navigation area. Adding this will remove it:
if (Build.VERSION.SDK_INT >=Build.VERSION_CODES.Q) {
window.setNavigationBarContrastEnforced(false)
}
Before / After
RecyclerView
The documentation mentions setting setting clipToPadding to false to allow items to be drawn under the paddings set for insets. Using this, in combination with setting the bottom padding on the RecyclerView, will ensure that the last item is not obscured. Alternatively, an ItemDecoration can be used to add the spacing at the bottom.
After writing this, I looked back at a project I migrated a few months back and forgot that I had seen and worked around some of these same problems before. Probably a good reason to document things earlier in the future. ↩︎
Alternative Title: “One cannot simply use string indices from Kotlin in Swift.”
One of the apps I am working on uses Kotlin Multiplatform for the business logic, and then has a specific Swift UI implementation for iOS and a Compose multiplatform implementation for other platforms. I built a fairly complex search feature that outputs a list of search results, with each result including the indices of the matched substrings to highlight in the text.
dataclassSearchResult(
val text: String,
val matches: List<IntRange>
)
Using this in Compose is pretty straight forward:
@ComposablefunSearchResultView(result: SearchResult) {
val annotatedString = AnnotatedString.Builder(result.text)
result.matches.forEach {
// +1 because addStyle's end is exclusive
annotatedString.addStyle(SpanStyle(color = Color.Red), it.first, it.endInclusive + 1)
}
Text(annotatedString.toAnnotatedString(), fontSize = 36.sp, textAlign = TextAlign.Center)
}
We notice that, on Android, each character has a slot, and the diacritics that are on top of the characters each have their own slot. On iOS, on the other hand, each slot contains a character with its diacritics, all in one slot.
Many individual characters, such as “é”, “김”, and “🇮🇳”, can be made up of multiple Unicode scalar values. These scalar values are combined by Unicode’s boundary algorithms into extended grapheme clusters, represented by the Swift Character type. Each element of a string is represented by a Character instance.
So how do we work around this? Swift provides a few different “views” on a String - a .utf8, .utf16, and .unicodeScalars. We are interested in .unicodeScalars:
for (index, scalar) in text.unicodeScalars.enumerated() {
    print("text[\(index)] = \(scalar)")
}
This method gives us values that match what we get with Kotlin:
What about .utf8? The utf-8 view gives us the individual bytes that make up each character in the string. For example, we see that text[0] is the character ي, which is U+064A. In utf-8, this is two bytes - D9 (217) and 0x8a (138), which correspond to the first two entries we get if we print the .utf8 view of the string.
Aside - in Kotlin, we can get the byte representation, similar to the .utf8 view in Swift, by using .encodeToByteArray():
Note that the values of a byte are from -128 to 127, so we need to convert to an unsigned byte to get values that we’d expect between 0 and 255.
Solutions
With all this in mind, we now have a few potential solutions we can take to have consistent highlighting between Swift and Kotlin. The first option is to use the .unicodeScalars view in Swift.
structSearchResultView: View {
let text: String
let ranges: [KotlinIntRange]
var body: some View {
Text(attributedString)
.font(.system(size: 64))
}
var attributedString: AttributedString {
var attributed = AttributedString(text)
for range in ranges {
iflet startIndex = text.unicodeScalars.index(text.unicodeScalars.startIndex, offsetBy: range.start.intValue, limitedBy: text.unicodeScalars.endIndex),
let endIndex = text.unicodeScalars.index(text.unicodeScalars.startIndex, offsetBy: range.endInclusive.intValue, limitedBy: text.unicodeScalars.endIndex) {
iflet attributedRange = Range(startIndex..<endIndex, in: attributed) {
attributed[attributedRange].foregroundColor = .red
}
}
}
return attributed
}
}
This solution is identical to our first solution, with the exception of the fact that we use text.unicodeScalars for the indices in place of just text. Because views on Swift Strings share indices, this range does what we expect when we apply it to the AttributedString.
Alternatively, instead of sending matches as a list of IntRanges, we can send back a list of Strings instead and use something like:
let match = "بۡنَ"iflet range = text.range(of: match,
range: text.startIndex..<text.endIndex) {
iflet attributedRange = Range(range, in: attributed) {
attributed[attributedRange].foregroundColor = .red
}
}
Either of these solutions would have the same result, and we’d get the expected output on iOS:
Abdulahi and I gave another talk this year at Droidcon NYC. This one talks about how to scale Android development without a monorepo. The talk discusses various topics, including:
building an architecture to support an app spread out over many repos
binary compatibility
tooling to understand changes to the dependency tree
The video is here, and the slides can be found here.
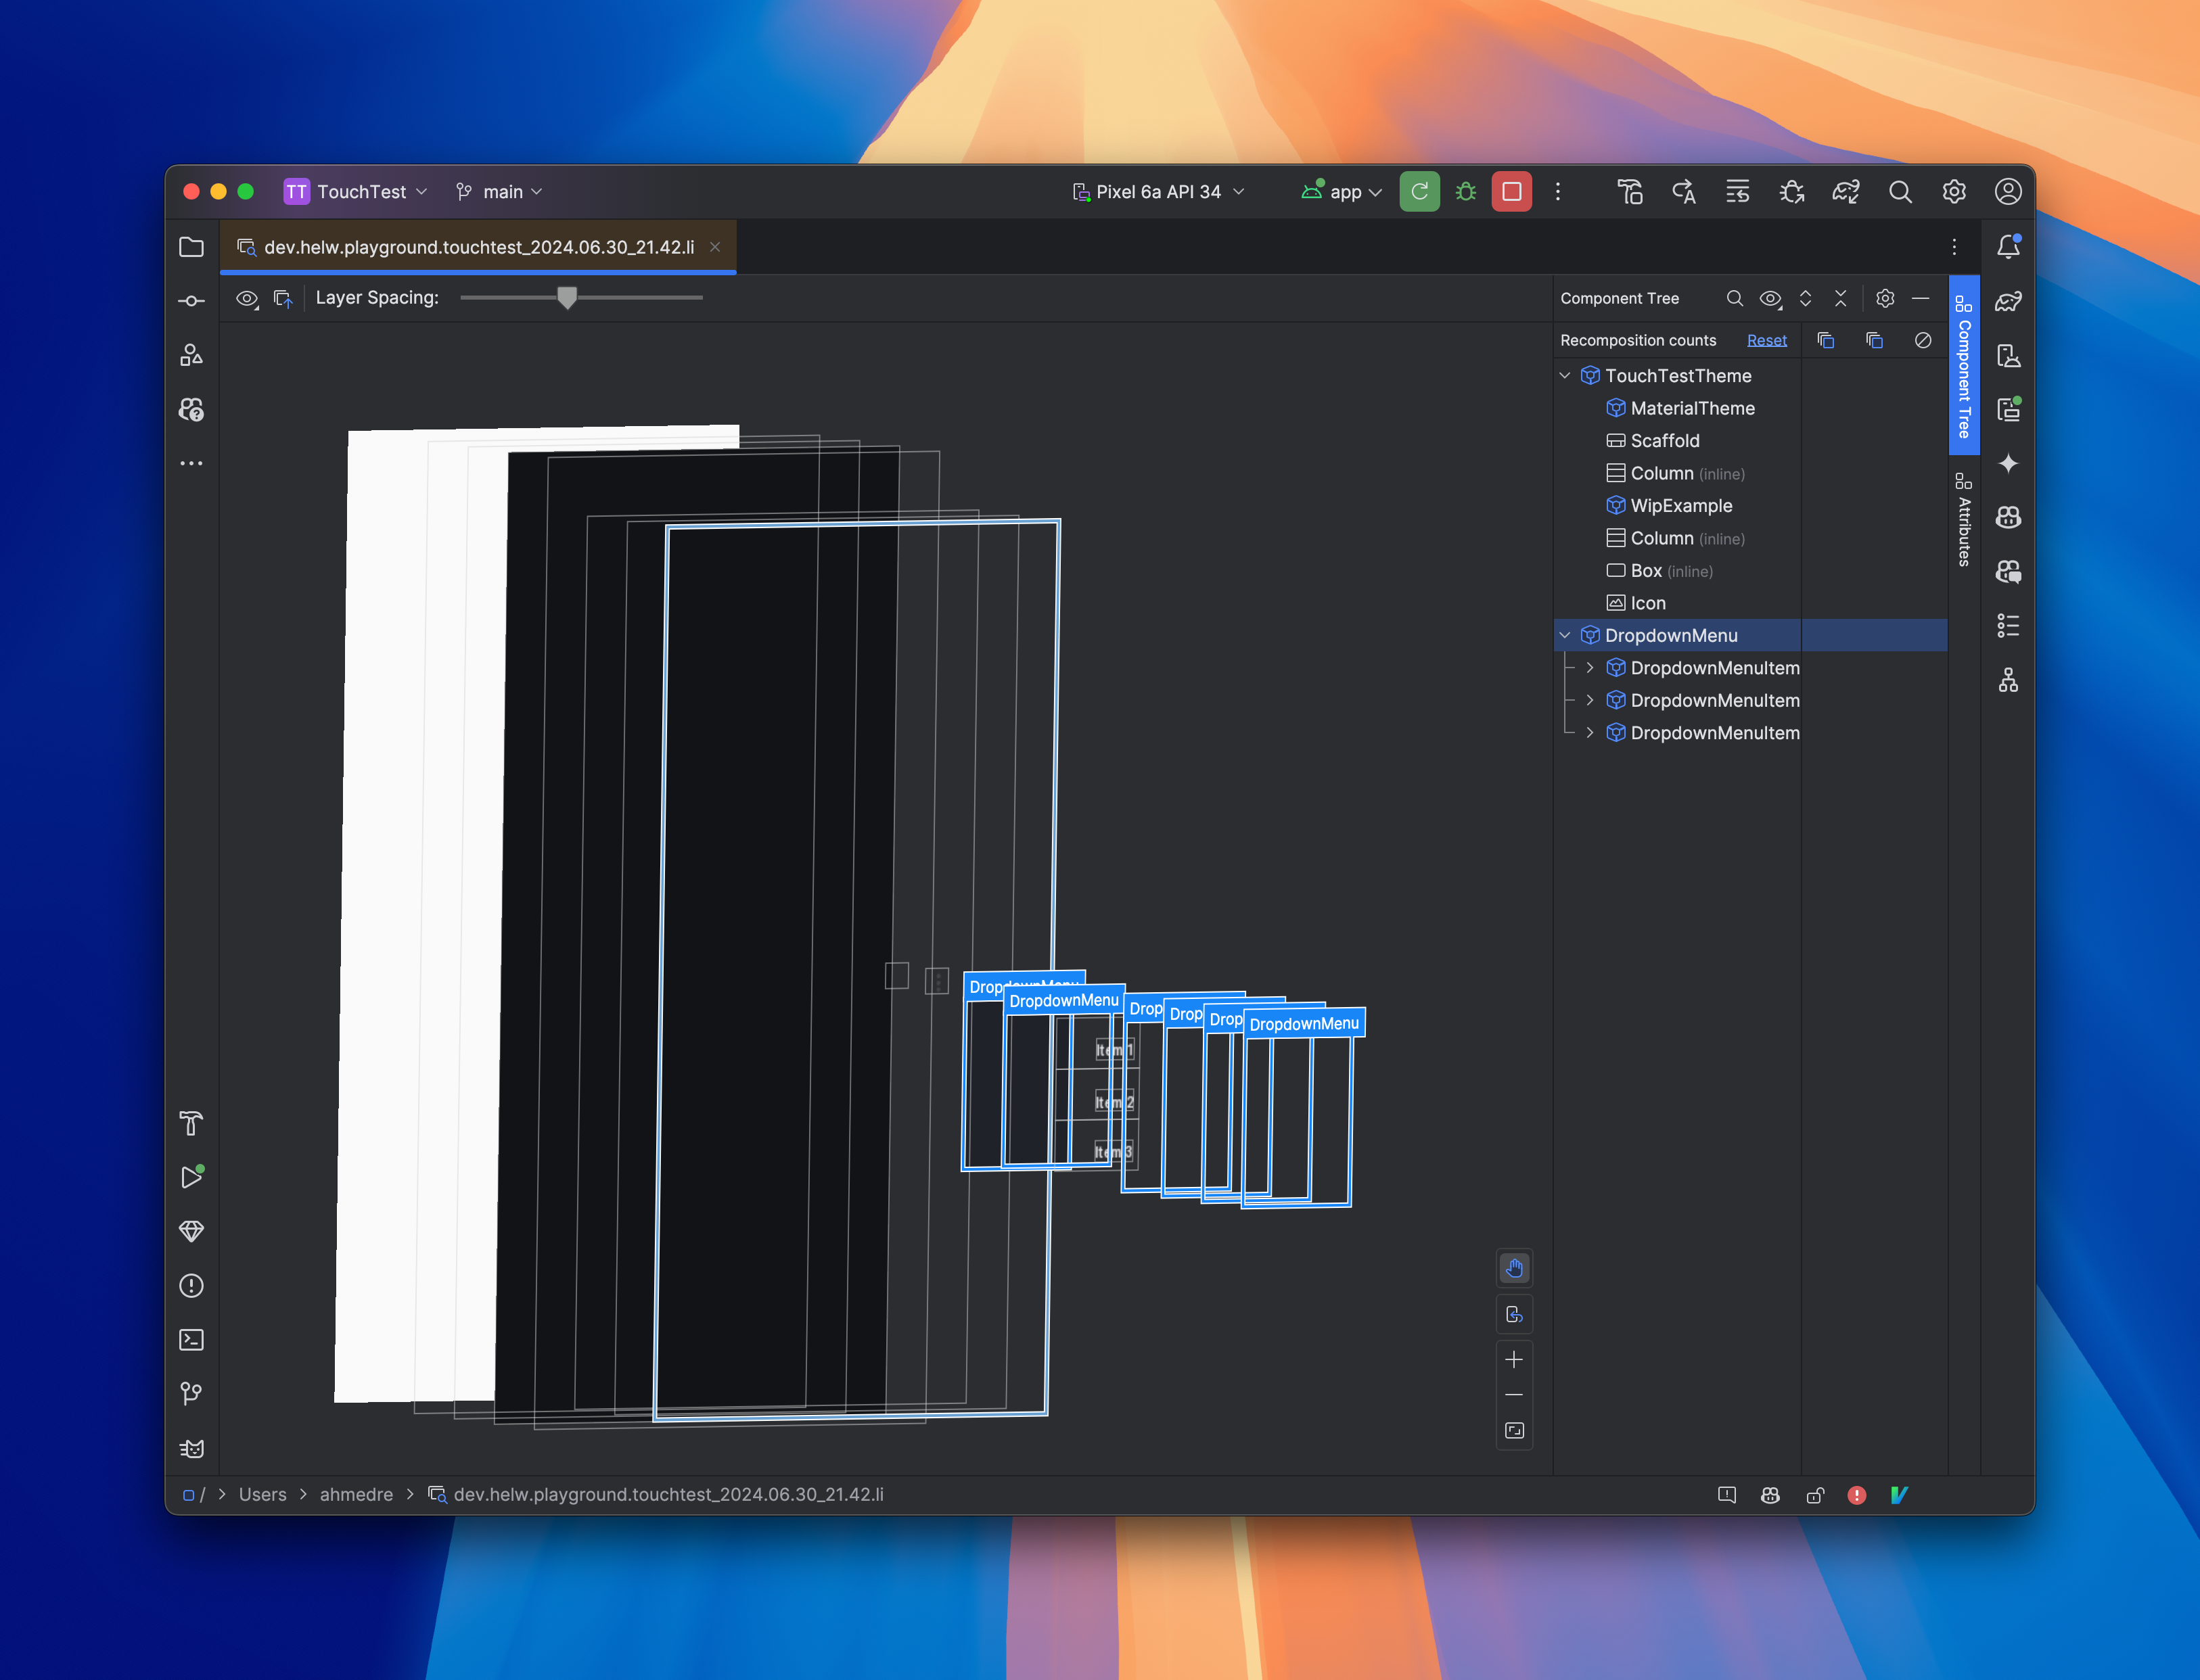
Recently, I spent some time trying to replicate a gesture I liked on iOS1. I had a simple button where, if you long press it, a menu shows up from which an item can be selected. On the iOS app, you could select an item from this menu in a single gesture. By long pressing the button and not letting go, you could drag your finger to the item and select a menu item in one gesture.
In this video, you can see this behavior in action:
second 1 - normal press on the button does an action
seconds 2-7 - long press on the button shows the menu. clicking an item selects it.
seconds 8-13 - use the gesture to simplify the second portion, by long pressing and selecting in a single gesture.
Implementation
Base Implementation
Let’s start with a simple implementation of the button and the menu.
If we run this, we’ll see an onDragStart, followed by a onDragCancel. This is because we have a long press on the Icon itself that conflicts with this drag gesture. Since this gesture detects long press for us, we’ll move the long press handling here to avoid the conflict2.
We’ll switch Modifier.combinedClickable with just Modifier.clickable, and move the showMenu.value = true into onDragStart. If we do this, we’ll see what the drag events we expect to see after seeing the onDragStart, and we’ll see onDragEnd once the drag is complete.
Ideally, we’d love to have the touch handling “transfer” to the DropdownMenu once we show it. Unfortunately, I couldn’t find a way to make this work, most likely due to the fact that the DropdownMenu is a Popup under the hood3. Consequently, we’ll have to handle the drag gesture calculations ourselves.
To do this, what we need is to know where the gesture is released, along with knowing the bounds of the DropdownMenuItems. With the combination of these, we can determine which item, if any, was selected, and perform the action.
We can add an onGloballyPositioned modifier to each item and to the box surrounding the menu itself. If we do this initially and just print the values, we’ll notice that the values we get for the position of the items are relative to the DropdownMenu itself, irrespective of whether we use boundsInRoot(), or boundsInWindow(). This is because the DropdownMenu is a Popup. In other words, the DropdownMenu’s origin is at (0, 0).
We know, however, that the DropdownMenu takes the position of the anchor it’s attached to. We can use this information to calculate the actual position on the screen to detect whether or not there is a hit. We do this by recording the position of the Box wrapping the anchor and the DropdownMenu.
With this, the remaining piece is to figure out, in onDragEnd, which item the drag ended at (if any). Since onDragEnd does not have any parameters about the ending position, we’ll have to store the position as it updates in onDrag. Afterwards, we can use this information in onDragEnd to check for a hit, in combination with the bounds of the items and the menu stored above.
We take the last position of the drag, and adjust it by the position of the menu’s anchor, in order to get positions relative to the DropdownMenu. In this case, because the menu opens anchoring to the bottom left of the anchor, we use that as the offset on the last drag position. We can then check for a match amongst our items. This works! 🎉
Improvements: Adding a Hover Effect
This works, but we no longer have any hover effect on each item when we drag over them. The DropdownMenuItem composable accepts an interactionSource, based on which it renders the hover effect. We can emit and memoize a PressInteraction.Press(pressPosition) when an item is hit, and emit a PressInteraction.Release(pressInteraction) when the item is no longer hovered over. We can do this within onDrag itself, though we need to explicitly map the position of the drag to the corresponding item, in a similar way to how we detected the item in onDragEnd.
// we need an interaction source per drop down menu item, since if we share them,
// we'd get all items selecting and unselecting together, irrespective of the position.
val interactionSources =
remember { arrayOf(MutableInteractionSource(), MutableInteractionSource(), MutableInteractionSource()) }
val lastInteractionItem = remember { mutableIntStateOf(-1) }
val lastInteractionPress = remember { mutableStateOf(Offset.Unspecified) }
// snip
onDrag = { change, dragAmount -> lastPosition.value = change.position
val adjustedTargetLocation = change.position.minus(menuAnchorBounds.value.bottomLeft)
val currentItem = items.value.indexOfFirst { adjustedTargetLocation init }
// if the item we are hovering over has changed...
if (currentItem != lastInteractionItem.intValue) {
// if it wasn't -1, we need to "release" the press on the old one
if (lastInteractionItem.intValue != -1) {
val interactionSource = interactionSources[lastInteractionItem.intValue]
interactionSource.tryEmit(
PressInteraction.Release(PressInteraction.Press(lastInteractionPress.value))
)
}
// if we have a chosen item, we need to "press" on the new one
if (currentItem != -1) {
val interactionSource = interactionSources[currentItem]
interactionSource.tryEmit(PressInteraction.Press(adjustedTargetLocation))
lastInteractionPress.value = adjustedTargetLocation
}
lastInteractionItem.intValue = currentItem
}
}
We’d then update our DropdownMenuItems to use the corresponding interactionSources[index].
Improvements: Fixing the unwanted Click bug
If we try this out, we notice everything works great, with one exception: if we long press the anchor and don’t drag at all, the menu shows up, but the “click” handle is also fired on the button, which isn’t what we want. If we drag, however, everything is fine. How do we fix this?
As the documentation tells us, there are three PointerEventPasses. We are interested in the PointerEventPass.Initial pass, which, as the documentation says:
In the Initial pass, the event flows from the top of the UI tree to the bottom. This flow allows a parent to intercept an event before the child can consume it.
This seems to be what we want. Moreover, The code also links an example of this in the implementation of the Tooltip in Material 3. Notice how, in lines 228 to 229 of the implementation, PointerEventPass.Initial pointer events are consumed, preventing them from being actioned by the children. We can see something similar to this in the detectDragGesturesAfterLongPress code as well (though without the pass specification, and only after a drag, which is why this issue only appears if we don’t drag).
The easiest way to fix this is to copy the detectDragGesturesAfterLongPress code, and consume the PointerEventPass.Initial events after calling the onDragStart lambda by adding these two lines after the onDragStart.invoke(drag.position) call:
// consume the children's click handling
val event = awaitPointerEvent(pass = PointerEventPass.Initial)
event.changes.forEach { if (it.changedToUp()) it.consume() }
Conclusion
Early on, I came across this artice about multiselection within a photo grid, which pointed me in the right direction after getting stuck with trying to find a way to “hand off” events to the menu. This was a fun experiment for something that, admittedly, is not likely to be discovered or used much in my app. The journey did help me increase my understanding of how touch is handled in Compose.
Special thanks to Efeturi for reviewing this post.
Efeturi tells me this is a pattern that was there on Android in the native view days as well. ↩︎
The click will also conflict, but we’ll resolve that later by consuming those gestures in PointerEventPass.Initial so that the child does not receive nor act on them. ↩︎
A combination of PointerInputModifierNode combined with sharePointerInputWithSiblings seemed promising, but actual DropdownMenuItems don’t get pointer events, likely due to being a Popup. ↩︎
Compose on the web has always fascinated me. It’s always been really cool to take a working application on Android and have it run with minimal changes on various other platforms, including the web. While I’ve written about it in the past and show cased it in talks, it’s always been a toy of sorts for me.
This changed one day when I wanted to write a tool for visualizing some data at work. I decided to write a desktop app, and, I opted to use Kotlin and Compse, guessing it’d be the fastest way to accomplish what I want. After making it work, I started thinking of how I could share this tool with my colleagues. Sharing jars or instructions for building wasn’t as interesting, so what about just sharing a url? This made the utility of Compose for web much more apparent to me.
In this post, I want to share a few odds and ends and tidbits that I learned while working on various Compose for Web projects.
Development is Fast
Generally speaking, Compose code written for Android will work on the web and in WebAssembly with minimal changes. There are still some differences, and often times, code that will compile on Android and JS (for example) won’t compile cleanly on WebAssembly. One work around for this is to use expect/actual to provide empty or no-op implementations for the offending platform and keep the real implementations where it compiles.
The development cycle is very fast, due to auto-reload whenever a change is made. Make sure to pass the -t flag to jsRun or wasmJsRun to ensure auto rebuilds and reloads of the page whenever changes are made. Without it, changes to the code seem to reload the page, but without reflecting any of the changes.
Deploying to Production is Easy
In a KMP project with web support, building the jsBrowserDistribution task (or wasmJsDistributionTask for WebAssembly) will output
a folder named productionExecutable under the build/dist/js or build/dist/wasm folder. These tasks will run optimizations (dead code removal, minification, etc). You can simply take the contents of that directory and deploy it to a server somewhere and it should just work. This makes for some compellingdemos. As I learned from one of those repos, it’s quite easy to wire this up to GitHub Pages on every merge.
One trick I use to validate this locally is going to the productionExecutable directory, and running a simple HTTP server with Python:
python3 -m http.server
This allows me to test the production version locally, since using file:// urls doesn’t work due to security restrictions in the browser.
Kotlin/JS on the Web is Client Side
When declaring support for a web project, we add the type of web projects supported - either browser or nodejs. Code targeting browser runs in the browser, which means it runs on the client’s machine, whereas code targeting nodejs can run on the server.
This all seems obvious, so why mention it? Unfortunately, sometimes, developers forget this point. I saw an open source project put in some clever amount of work to hide an api key, wiring it through GitHub secrets to an environment variable in GitHub Actions, and then injecting it into the code at build time using BuildKonfig. The problem is that the code runs in the browser, so the api key is exposed to anyone who cared to look at the networking logs in the developer console.
As a workaround, the project could have a server side component that does the actual logic of talking to the third party API, and the web code can talk to this component. This keeps the API key from being exposed to the client, and allows the developer to control access to the API (add rate limiting, caching, etc).
Cross-Origin Resource Sharing (CORS)
Thanks to coil3, showing images from a URL is as easy as a few lines of code in Compose:
This works well and looks great, but when you try it on web, you often find yourself running into images that don’t load. Looking at the logs, you see things like:
Access to fetch at '<url>' from origin 'http://localhost:8080' has been blocked
by CORS policy: No 'Access-Control-Allow-Origin' header is present on the requested resource.
Today, browsers have security checks that disallow loading resources from other domains, unless those domains explicitly allow it. This type of check helps prevent CSRF and various other attacks. This effectively means that the same URL an be read using curl or OkHttpClient, but not from the web due to these web browser security checks.
So what can you do?
If you own the server, you can add the Access-Control-Allow-Origin header to the response. This tells the browser that it’s okay to load the resource from this particular domain.
If you only want to test locally, you can disable CORS checks in your browser.
Another option is to configure a proxy server that you own and control to fetch the resource and serve it back to the client. The server can easily get the resources (since there are no CORS checks outside of the browser), and can set the proper headers when serving the resource back to the client. There are various open source solutions that also do this.
Kotlin/Wasm and Kotlin/JS
I wrote before about using Compose/JS without WebAssembly. That having been said, the code for both is often very easy to share, since it’s almost identical. One of the exciting promises of WebAssembly today is the massive performance benefits in comparison to vanilla JavaScript. While today, wasm is supported out of the box (without special configurations) on Chrome and Firefox, it still doesn’t work on Safari just yet.
One thing I learned is that even Compose/JS uses WebAssembly under the hood for Skia drawing via Skiko. As of this writing, the size of the WebAssembly artifacts for this repository is around 28mb, whereas the size of the non-WebAssembly version is 13mb (uncompressed). Close to 8.5mb of these come from Skiko in both versions (with matching md5 sums of these files).
As of this writing, Ktor has a 3.0.0-wasm1 version that supports WebAssembly in its EAP repository. This version worked for me for both vanilla JavaScript and WebAssembly in debug, though release versions of JavaScript code failed to run. I worked around this for now by only using the 3.0.0-wasm1 version for wasm targets, and using the stable 2.3.8 version for JavaScript targets.
My coworker Abdulahi Osoble and I recently gave a talk at Droidcon NYC about how to use a design system to make building Server Driven UI easier. We go through the motivations and building blocks, along with architectural decisions that need to be made along the way.
The video is here, the slide deck is here, and the accompanying open source repository is here. The repository is my favorite part, since it showcases a fictional micro-design system running on multiple platforms, and showcases Server Driven UI working on all of these platforms with the same source json.